


Struggling to prove the impact of your sales enablement work?
As sales enablement professionals, we know that sales enablement plays a strategic, proactive role in sales performance.
But in a sales process with lots of moving parts (from inbound lead quality to sales rep skill) it can be tough to pinpoint and report on exactly how influential a sales enablement project has been.
Perfect proof will always be difficult to find, but we’ve found that you can build a persuasive argument with a healthy mix of quantitative and qualitative data points. In other words, use both numbers and stories to show your success.
In this article, we’ll walk through how to measure sales enablement success with KPIs and qualitative insights. We’ll also explain why it’s important to align your enablement work with business objectives so the impact can’t go unnoticed.
In this article:
- Case study: Example of a successful sales enablement project (and its measurement)
- Metrics to measure: 13 quantitative & qualitative enablement KPIs and how they work.
- Best practice: 3 insider tips for measuring enablement success
What does it mean to measure sales enablement success?
Real-world example: How this company measured sales enablement successfully
Want to prove your sales enablement value fast? Tie it directly to your company’s most pressing business challenges.
When you meet “top of mind” goals, the results often speak for themselves.
Spekit’s sales enablement consultant, Jacki Arnic, shared a client story to demonstrate this.
The challenge:
Jacki's client had just acquired another company. But the two sales teams, one from the original company and one from the newly acquired company, struggled to identify cross-selling opportunities across the combined customer bases.
The solution:
Jacki and the Product Marketing team implemented a rapid ramp program, including:
- Product Portfolio Training: Comprehensive training on the combined product offerings.
- Collaboration Resources: Quick guides and customer-facing materials to facilitate teamwork.
- Opportunity Routing: A clear process for identifying and routing cross-selling opportunities.
“Once routed, reps would collaborate with their internal counterparts in the deal process, which was a net new action for them so they had some quick guides and customer-facing materials to support here as well.”
This new program enabled reps to quickly get up to speed on their product portfolios, collaborate with their new colleagues, and effectively sell more to each other’s customer bases.
How they measured success and reported on their sales enablement KPIs
To demonstrate final sales outcomes, Jacki and the team measured both quantitative and qualitative metrics:
- Cross-selling opportunities identified (this was a pre-deal stage and identified in a tracker within their CRM)
- Collaboration calls made with internal counterparts for opportunity validation
- Opportunities created
- Number of customer calls made with both reps on the line
- Time to first deal
- Deals closed within the first 120 days
- Percentage of reps identifying expansion opportunities by a specific date
- Percentage of reps with at least one opportunity created
- Percentage of reps completing collaboration discovery calls
All these KPIs directly aligned with the major business objectives (to improve collaboration and drive more opportunities).
To definitively measure the role of the sales enablement project, Jacki also reported on these data points:
- Training: Reps who actively participated in the rapid ramp program all had 1 or more opportunities created within the first 90 days
- Content usage: Reps with multiple touches on the internal use content (quick guides, videos, etc) were the first to log opportunities.
- Reinforcement: Reps who passed the reinforcement quizzes were also part of the group that logged opportunities and started collaborating with their internal counterparts first.
These are harder-to-measure metrics, but they help tell the story of how sales enablement contributed.
So far, we've only scratched the surface of available sales enablement KPIs. Let's look at the full range of metrics that you can measure to prove the success of your upcoming sales enablement project.
Which sales enablement KPIs should you measure?
As Jacki’s story illustrates, measuring sales enablement success requires looking at both the big picture and the immediate impact.
That’s why a balanced approach (one that includes both long-term and short-term KPIs) is key.
Broadly, these key metrics fall into two categories:
- Qualitative KPIs, which assess skills, confidence, and training effectiveness to see how enablement initiatives influence rep behavior and contribute to quantitative KPIs (metrics).
- Quantitative KPIs, which measure tangible outcomes such as revenue, conversion rates, and sales efficiency ratio.
Jacki Arnic, emphasizes the importance of tracking qualitative KPIs:
“While numerical data is important, qualitative data such as feedback from sales reps and managers can also provide valuable insights that might often get overlooked. I really like to dig into this one where I can.”
Let’s break both types down:
24 qualitative sales enablement KPIs
Qualitative KPIs look at what the numbers alone cannot show.
They capture things like how confident your reps feel, how well they are applying new skills, and whether your training is actually changing their behavior. These insights help you see how your enablement work is influencing performance, long before it shows up in traditional outcome metrics.
Here are some qualitative sales enablement KPIs you can track and why:
1. Sales Process Proficiency KPIs
“Sales process proficiency” measures how well reps execute each stage of the sales process, from lead qualification to closing deals.
It reflects their ability to qualify leads, advance deals, handle objections, and close effectively. When reps improve their process proficiency, they reduce deal friction and increase conversion rates.
For example, if you implement an AI-powered sales enablement tool that guides reps through each deal stage, provides real-time insights, and reinforces best practices, and your average time to complete qualification steps decreases from 3 days to 1 day, or the percentage of deals following the correct sequence of steps increases from 65% to 85%, it suggests that optimizing your sales process is improving proficiency.
To measure sales process proficiency, track:
Stage-specific conversion rates
- What: Tracks the percentage of deals that move from one stage of the sales pipeline to the next.
- Why: Higher conversion rates at different stages indicate that reps are following the sales process effectively.
- How: Measure how many deals successfully progress to the next stage.
- Example: If proposal conversion rates increase from 20% to 30%, it suggests that sales enablement efforts are improving deal progression.
Sales cycle time changes
- What: Measures how long it takes for a deal to move from first contact to closing.
- Why: A shorter sales cycle indicates that reps are engaging and converting prospects more efficiently.
- How: Track how long deals take to move from first contact to close, and analyze time spent at each pipeline stage to identify bottlenecks.
- Example: If your sales cycle drops from 45 to 30 days, it shows process improvements are making a difference.
Call and demo performance scores
- What: Evaluates how well reps handle calls and demos based on objection handling, storytelling, and value communication.
- Why: Higher performance scores indicate better engagement and stronger deal progression.
- How: Use structured rubrics or call analytics tools (e.g., Gong, Chorus) to assess recorded calls and demos.
- Example: If demo performance scores rise from 60% to 85%, it shows reps are improving.
CRM data completion rates
- What: Tracks the accuracy and completeness of CRM entries, including notes and next steps.
- Why: Higher completion rates indicate that reps are logging critical deal insights, ensuring better follow-ups and pipeline forecasting.
- How: Audit CRM entries for completeness and consistency.
- Example: If CRM completion rates improve from 60% to 90%, it proves better deal tracking and pipeline visibility.
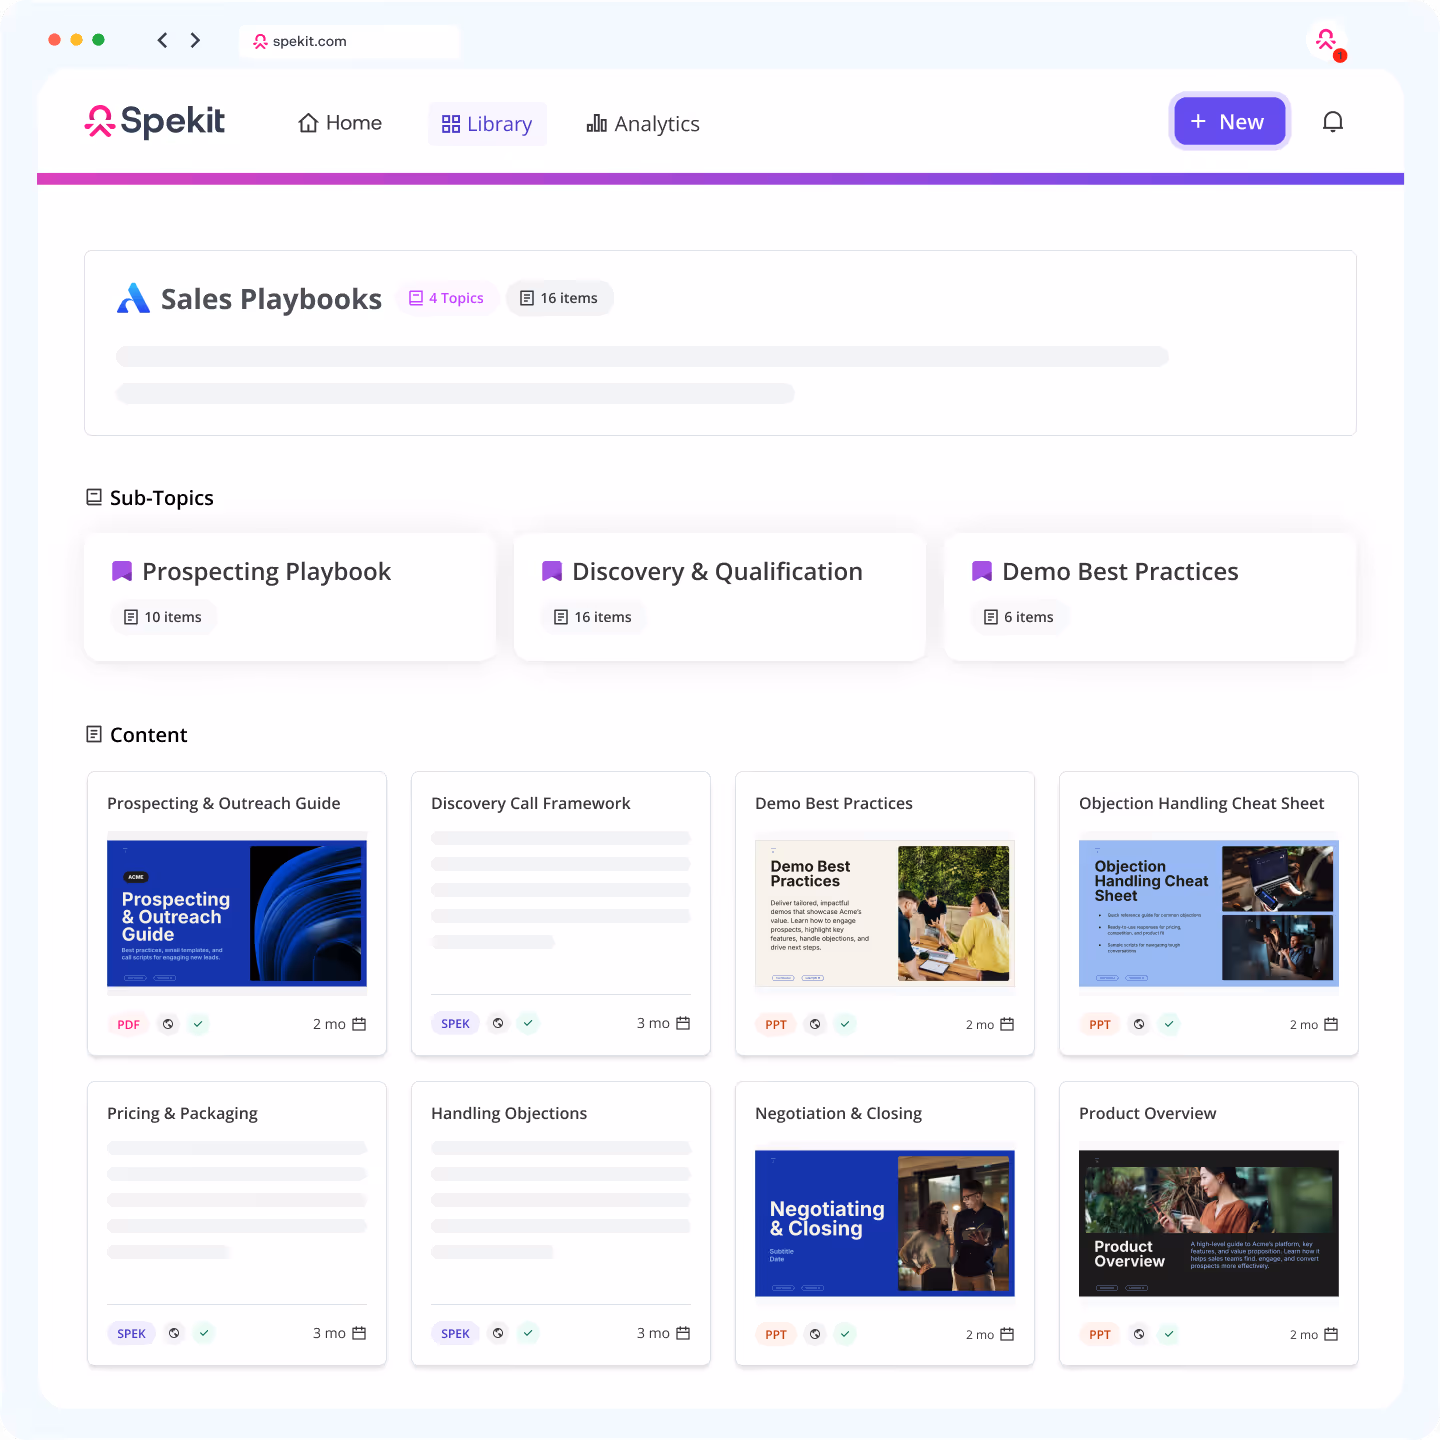
Spekit overview: Modern AI-powered enablement in the flow of work
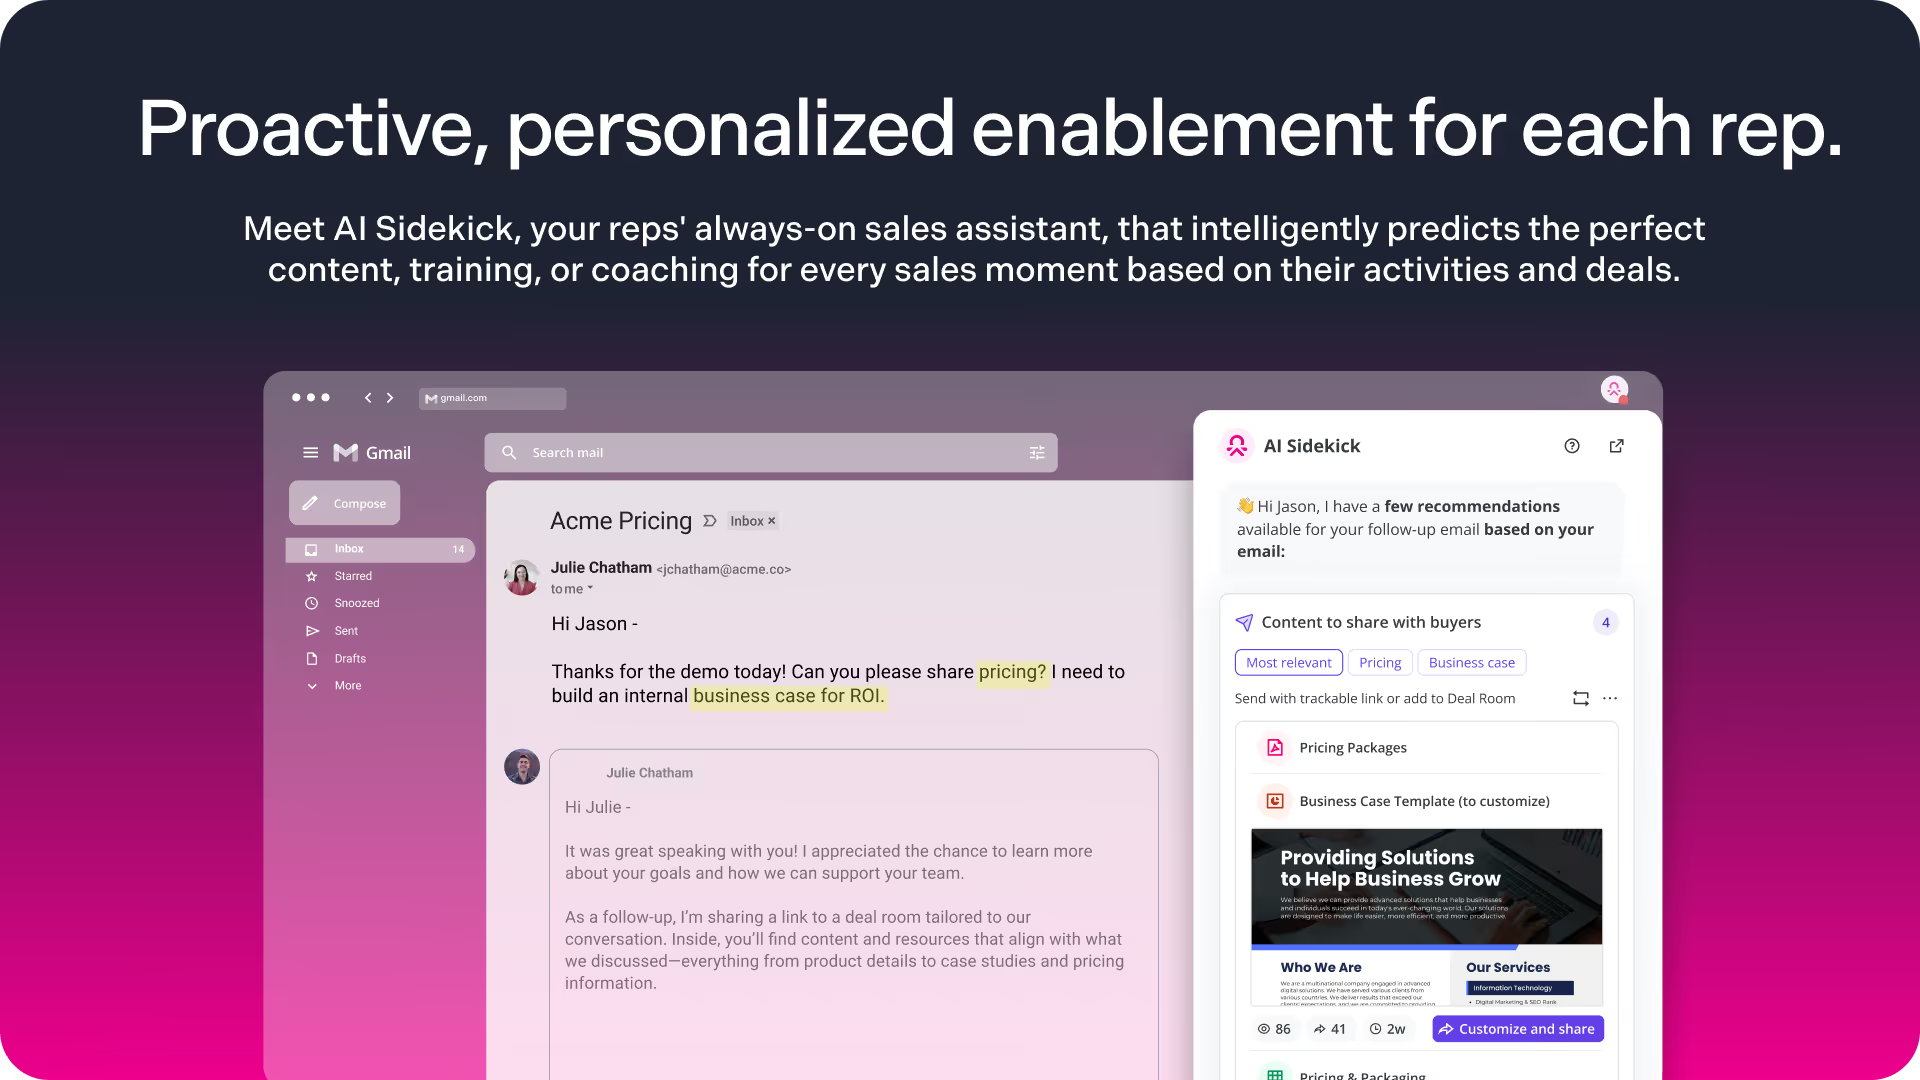
Spekit the modern AI-powered enablement platform that unifies content management, sales playbooks, enablement, and automation to help revenue teams move faster and close deals quicker. Spekit combines intelligent content management with AI Sidekick, the only just-in-time sales assistant™ that leverages signals from CRM, call intelligence, and communication tools to deliver personalized guidance, content, and recommendations directly to reps.
Use Spekit to:
- Sync and update content automatically: Unify all your content, from playbooks to decks to videos, in one centralized, AI-powered platform. Spekit automatically syncs with your existing repositories like Google Drive, SharePoint, and Confluence, ensuring every asset stays up to date without manual tagging or upkeep. Built-in AI governance flags outdated or low-adoption content, keeping everything current and trusted.
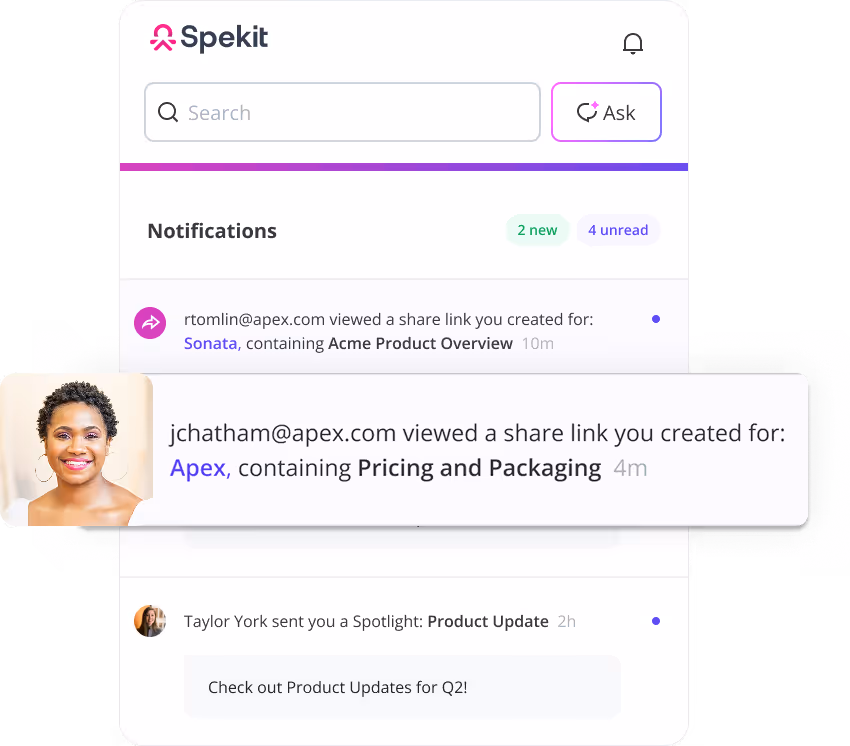
- Create Deal Rooms: Create buyer-ready content hubs in seconds with AI Sidekick. Spekit’s Deal Rooms let reps curate, personalize, and share content through a single, trackable link. Every update syncs instantly, while buyer engagement analytics reveal who viewed what, when, and for how long—connecting content activity directly to pipeline impact.
- Standardize sales processes: Surface playbooks, qualification frameworks, and stage-based guidance right inside your CRM or communication tools so reps follow consistent, proven processes in real time. AI Sidekick proactively recommends the next best action or piece of content based on deal context.
- Coach in context: AI Sidekick, the only just-in-time sales assistant™, delivers personalized talk tracks, objection handling, and follow-up recommendations directly in your reps’ workflow. Whether in Salesforce, Gong, or Gmail, it anticipates needs and surfaces the right guidance before they have to search.
- Provide just-in-time learning: Deliver role-based training and microlearning moments at the exact time and place reps need them. Spekit’s contextual delivery ensures knowledge is reinforced within the flow of work, not in another platform or course library.
- Reduce decay and increase adoption: AI-powered content governance, freshness scores, and ownership tracking prevent outdated content from slipping through. Real-time alerts notify reps and admins when changes occur, maintaining trust in every asset.
- Accelerate ramp time: Embed process steps, product knowledge, and best practices directly into the tools new reps use every day. With contextual prompts and in-app learning, teams onboard faster and start contributing to revenue sooner.
Watch how Spekit's modern AI sales enablement platform can help you:
2. Demo Proficiency KPIs
“Demo proficiency” measures how well reps deliver product demos, clearly communicate value, and address customer concerns. It reflects their ability to connect product features to the prospect's specific needs.
A well-executed demo builds buyer confidence, making them more likely to move forward, which ultimately improves close rates.
For instance, if your sales enablement team provides reps with instant access to training materials, talk tracks, and top-performing call recordings, and its demo-to-close rate increases from 20% to 28%, it suggests that better demo enablement is contributing to stronger conversion rates.
To measure demo proficiency, track:
Demo performance scores
- What: Evaluates how well reps conduct demos based on clarity, objection handling, and value communication.
- Why: Higher scores indicate that reps are improving their ability to engage and convert prospects.
- How: Use a structured rubric to assess recorded demos.
- Example: If demo scores improve from 65% to 85%, it shows that enablement efforts are working.
Close rates from demos
- What: Compares the close rate of deals with a demo versus those without.
- Why: A higher close rate for demo-included deals proves that strong demos influence conversions.
- How: Tag deals in the CRM as "demo" or "no-demo" and compare close rates.
- Example: If deals with demos close at a 20% higher rate, it confirms that improved demo skills are driving sales.
Prospect engagement during demos
- What: Tracks how prospects interact during demos, such as asking questions and staying engaged.
- Why: Higher engagement signals stronger interest and higher conversion potential.
- How: Use call analytics tools to track interactions during demos.
- Example: If prospects ask 40% more questions after demo training, it suggests enablement is making demos more compelling.
Demo follow-up actions
- What: Measures how many prospects take action after a demo, like requesting a proposal or scheduling another call.
- Why: More follow-up actions show that reps are delivering impactful demos that build urgency.
- How: Track post-demo actions using CRM data.
- Example: If demo-to-next-step conversions increase by 30%, it confirms that sales enablement is helping reps drive deals forward.
Use Spekit to improve demo efficiency.
Spekit helps teams reinforce sales enablement best practices directly within their workflow. Instead of relying on one-time training sessions or buried resources, reps get immediate, in-context guidance that directly improves demo execution and conversion rates.
Sidekick puts demo guides, talk tracks, and competitive angles beside the meeting so reps never tab away. Insert the right case study from Gmail or Outlook, pull a relevant Gong call for proof, and add assets to a Deal Room in one click.
Sales teams can also embed rubrics, best practices, and real-time coaching tips that reinforce demo scoring criteria directly into their workflow. This ensures reps understand what makes a great demo and can quickly access guidance on areas needing improvement.
3. Sales Content Engagement KPIs
Content engagement tracking measures how buyers interact with sales materials such as pitch decks, case studies, and proposals. It helps sales teams understand which content resonates most with prospects and how it influences deal progression.
Using trackable links, sales teams gain insights into how buyers engage with content, helping them prioritize follow-ups and refine messaging.
For instance, if data shows that prospects open case studies more than other content types, it suggests they find success stories compelling. Sales teams can use this insight to create more case studies that highlight real-life results and reinforce key value propositions.
To measure content engagement, track:
Content open rates
- What: Tracks how often buyers open shared sales enablement materials.
- Why: High open rates indicate that content is relevant and engaging to prospects.
- How: Use trackable link analytics to monitor open rates.
- Example: If buyers open 80% of shared SmartSend links, it proves that reps are sending relevant, valuable content.
Time spent on content
- What: Measures how long buyers engage with shared materials.
- Why: More time spent on content suggests deeper interest and stronger buying intent.
- How: Use content tracking tools to measure time spent per document.
- Example: If decision-makers spend 5+ minutes reading a proposal, it indicates serious interest.
Real-time buyer alerts
- What: Tracks when buyers engage with sales content.
- Why: Instant engagement notifications allow reps to follow up when interest is highest.
- How: Enable real-time alerts for opened or viewed content.
- Example: If a prospect opens a proposal twice within 24 hours, the rep can follow up immediately to capitalize on interest.
Conversion from tracked content
- What: Measures how many deals involve engagement with shared content.
- Why: Shows the direct impact of sales materials on deal progression.
- How: Compare close rates of prospects who engaged with content versus those who didn't.
- Example: If 60% of deals closed involved buyers engaging with shared materials, it confirms that content influences sales success.
4. Sales Rep Confidence KPIs
Sales rep confidence measures a rep’s ability to present solutions, handle objections, and negotiate effectively with assurance. It reflects their product knowledge, sales skills, and ability to engage persuasively with customers.
Confidence improves a rep’s ability to justify value, negotiate effectively, and close higher-value deals. When reps feel prepared, they are more likely to handle objections smoothly, communicate value clearly, and confidently push for larger deals.
For instance, if a company implements a sales enablement platform that provides real-time training, playbooks, and sales insights, and the average deal size increases from $15,000 to $20,000, it suggests that improved rep confidence is contributing to closing larger deals.
To measure sales rep confidence, track:
Confidence survey scores
- What: Measures how confident reps feel in their product knowledge, objection handling, and negotiation skills.
- Why: A rise in confidence scores indicates that reps feel better prepared, which can lead to larger deals.
- How: Use surveys to assess confidence in key areas.
- Example: If confidence scores increase from 6.5 to 8.5 (on a 10-point scale), it suggests that enablement efforts are making reps feel more prepared.
Pre- and post-training confidence levels
- What: Tracks how confidence levels change before and after enablement programs.
- Why: If reps report feeling more confident after training, it validates the program's effectiveness.
- How: Conduct confidence surveys before and after training.
- Example: If 75% of reps feel more confident handling objections post-training, it proves enablement is working.
CRM-based confidence training
- What: Tracks confidence data in CRM systems and compares it to deal size.
- Why: Linking confidence levels to deal size shows whether enablement initiatives drive revenue growth.
- How: Use a "Rep Confidence Score" in CRM and compare it to closed deal values.
- Example: If reps with a confidence score of 9+ close deals 25% larger than those with a score below 7, it suggests that higher confidence contributes to better deal outcomes.
5. Measure Knowledge Retention and Unlearning KPIs
Knowledge retention and unlearning measure how effectively sales reps retain up-to-date product knowledge while also discarding outdated or incorrect information.
Reps who retain accurate, up-to-date knowledge can position the product better, handle objections with confidence, and tackle complex sales conversations smoothly.
This can help them land higher-value deals.
For instance, if you implement a structured knowledge retention program and your average deal size increases by 18%, it suggests that reinforcing sales knowledge contributes to higher deal value.
To measure knowledge retention and unlearning, track:
Knowledge retention assessments
- What: Measures how well reps retain key product and sales knowledge over time.
- Why: Consistently applying critical knowledge leads to higher deal sizes.
- How: Conduct regular tests on product details, pricing, and objection handling.
- Example: If reps scoring 85%+ on retention tests close 20% larger deals, it proves that knowledge retention directly impacts deal value.
Pre- and post-training knowledge retention scores
- What: Tracks how much information reps retain after training and whether knowledge gaps decrease.
- Why: Higher retention after training shows that enablement efforts are working.
- How: Test reps before and after training sessions to measure improvement.
- Example: If reps improve from 60% to 90% on post-training assessments and their average deal size grows by 18%, it confirms that training positively impacts revenue.
Unlearning obsolete sales practices
- What: Measures how well reps replace outdated techniques with modern, more effective approaches.
- Why: Replacing ineffective methods leads to stronger negotiations and bigger deals.
- How: Track incorrect responses on sales knowledge tests before and after enablement initiatives.
- Example: If incorrect responses drop from 40% to 10% after a targeted unlearning program, and reps close 15% larger deals, it proves that unlearning outdated practices boosts revenue.
Real-time knowledge application in sales calls
- What: Tracks how well reps apply learned sales techniques and insights during real conversations.
- Why: If reps use accurate product positioning and competitive insights, they increase deal value.
- How: Use AI-driven call analysis tools to assess rep performance during sales calls.
- Example: If reps applying correct product positioning 90% of the time see their deal sizes grow by 22%, it proves that real-time knowledge application directly impacts revenue.
6. Analyze Content Efficiency KPIs
Content efficiency measures how effectively sales materials support reps in engaging prospects, handling objections, and accelerating deal progression.
Measuring sales productivity through content efficiency reveals how quickly reps access the right information and convert it into meaningful prospect interactions.
For instance, if a company implements an AI-powered sales enablement platform like Spekit—providing reps with instant access to sales content, playbooks, and competitive insights—and sees the sales cycle shorten by 15%, it suggests that improved content accessibility contributes to higher efficiency and faster deal closures.
To measure content efficiency, track:
Content usage metrics
- What: Tracks how often reps access, share, and use content.
- Why: Frequent use of high-impact materials proves content is valuable and improving sales performance.
- How: Use analytics to monitor downloads, shares, and views.
- Example: If reps increase case study usage by 40% and sales cycle time drops by 15%, it confirms that content efficiency is improving sales productivity.
Content effectiveness score
- What: Measures how much content contributes to closed deals.
- Why: A higher percentage shows that reps rely on content to drive sales conversations and close deals faster.
- How: Use the formula: (Deals influenced by content / Total deals) × 100.
- Example: If content effectiveness increases from 30% to 50%, it proves that content plays a bigger role in deal closures.
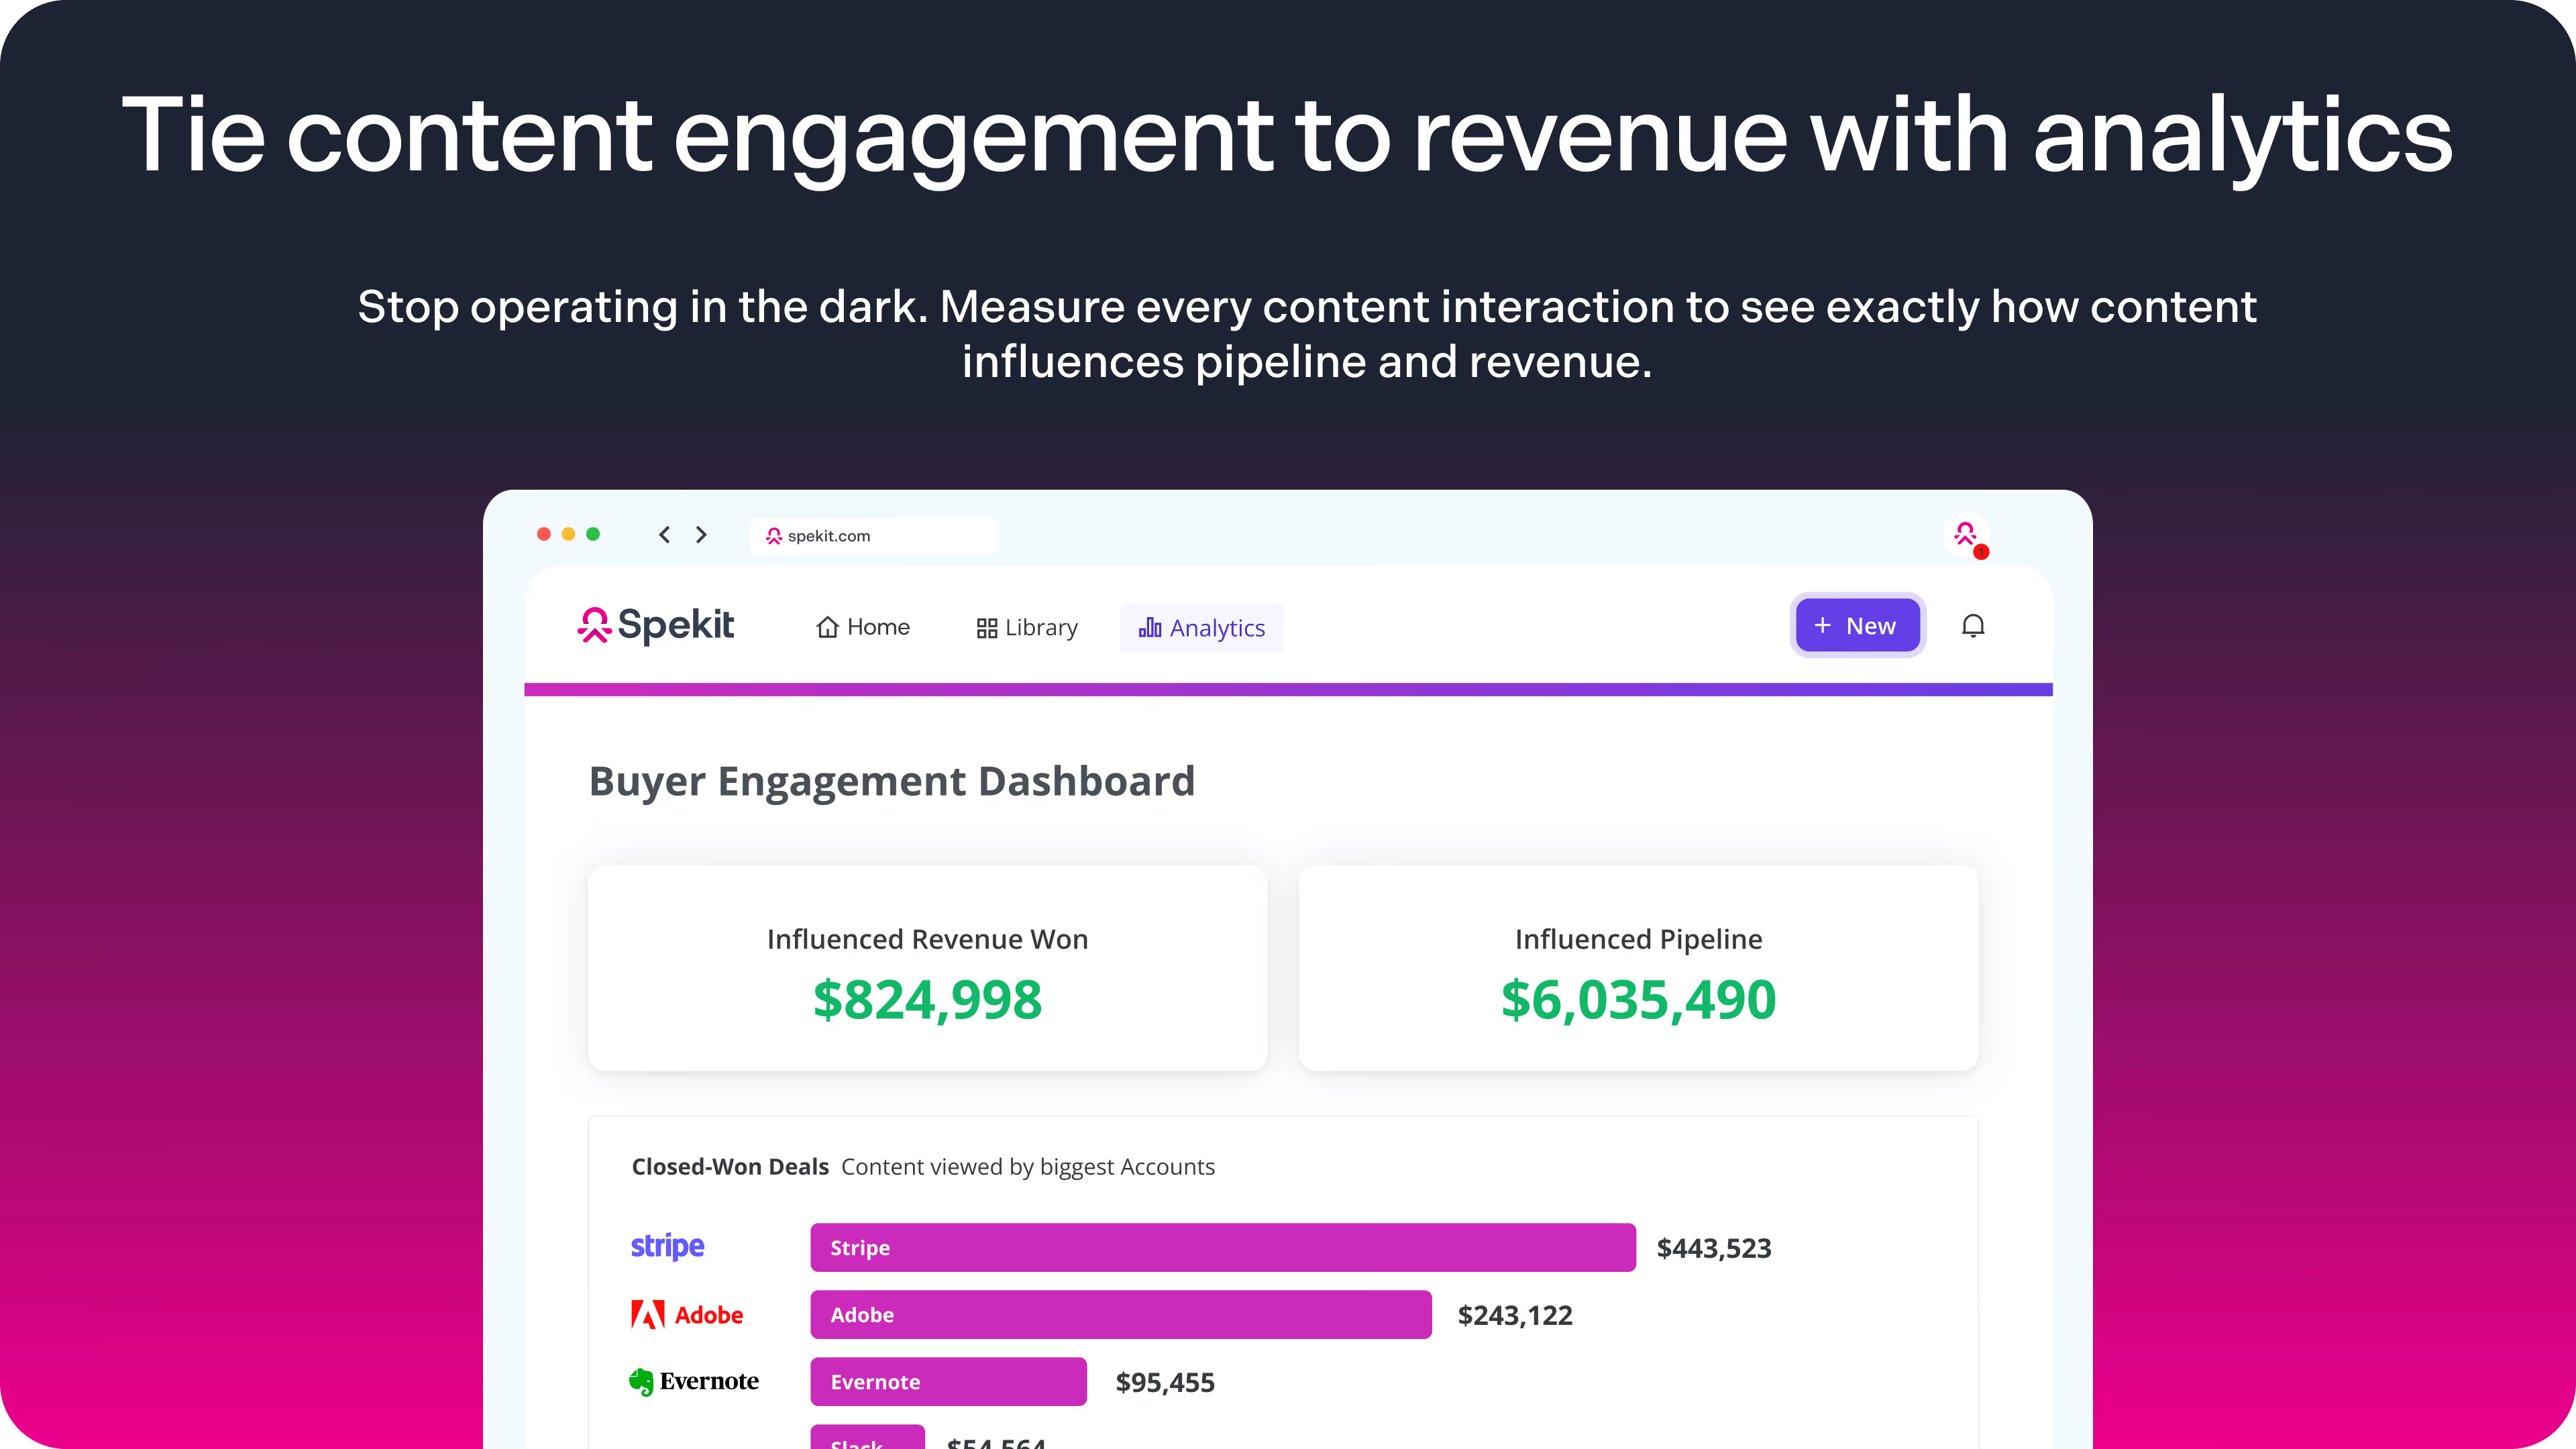
Content-influenced deal tracking
- What: Tracks the percentage of closed deals influenced by content.
- Why: High influence rates show that content accelerates the sales process.
- How: Tag deals in CRM based on influencing content and analyze revenue impact.
- Example: If 60% of closed deals were content-driven and revenue from these deals increases by 25%, it confirms content efficiency is improving sales outcomes.
Engagement with Content in Sales Conversations
- What: Measures how often reps use content during pitches and demos.
- Why: Frequent usage proves content helps handle objections and improve conversions.
- How: Use AI-driven tools or sales call analytics to track content references.
- Example: If reps using product comparison sheets see a 35% higher conversion rate, it proves content efficiency drives better sales results.
Use Spekit to improve content efficiency.
Spekit ensures sales reps always have the right content at the right time by providing instant access to training materials, sales playbooks, and buyer-focused content, directly within their workflow.
With Spekit, you can:
- Eliminate content chaos: Keep sales materials organized and instantly accessible, so reps spend less time searching and more time selling.
- Enable reps in real time: Deliver sales playbooks, case studies, and competitive insights exactly when and where reps need them.
- Optimize content based on usage data: Track engagement metrics to understand which materials reps use most and refine content accordingly.
7 Quantitative Sales Enablement KPIs
Quantitative sales enablement metrics provide concrete, measurable proof of enablement effectiveness. They offer clear insights into sales performance, enhance internal reporting, and help justify continued investment in enablement initiatives.
Below are seven essential sales enablement KPIs we recommend tracking to demonstrate the ROI of enablement initiatives effectively.
Let’s break them down.
1. Lead-to-Opportunity Conversion Rate
“Lead-to-opportunity conversion rate” measures how effectively leads are qualified and moved into the sales pipeline.
A higher rate indicates a strong early-stage sales enablement impact, meaning reps are successfully identifying, engaging, and qualifying high-quality leads.
For instance, if 250 out of 1,000 leads convert into opportunities, your conversion rate is 25%. If sales enablement increases it to 35%, it proves that early-stage sales enablement is improving lead quality and engagement.
Formula:
Lead-to-Opportunity Conversion Rate =
(Number of leads converted to opportunities / Total number of leads) × 100
Use Spekit to improve your lead-to-opportunity conversion rate.
It enables reps to qualify leads more effectively by providing instant access to content like:
- Lead qualification criteria: To help reps assess lead fit accurately based on predefined scoring frameworks.
- Discovery call guides: To equip reps with the right questions to uncover prospect needs and pain points.
- Sales playbooks and messaging templates: To help reps create personalized outreach that improves engagement.
2. Lead-to-Customer Conversion Rate
“Lead-to-customer conversion rate” measures how efficiently leads move through the sales cycle to become paying customers.
A higher rate indicates strong sales performance, better lead engagement, and better alignment between sales and marketing, all of which drive revenue growth.
For instance, if your team generates 5,000 leads and 100 become customers, your lead-to-customer conversion rate is 2%. If sales enablement increases it to 3.5%, it proves that better training and resources are accelerating deal closures and increasing revenue.
Formula:
Lead-to-Customer Conversion Rate =
(Number of converted customers / Total number of leads) × 100
Use Spekit to improve your lead-to-customer conversion rate.
Spekit helps reps convert leads into customers more efficiently by providing instant access to:
- Lead nurturing playbooks: To guide reps on engaging and following up with leads effectively.
- Deal acceleration insights: To provide real-time recommendations on how to move deals forward.
- Objection-handling frameworks: To help reps confidently address common concerns and close more deals.
3.Average Deal Size
“Average deal size” measures the value of closed deals and shows how effectively enablement helps reps drive higher-value transactions.
A higher average deal size indicates that reps are successfully using value-based selling, upselling, and negotiation techniques to maximize revenue opportunities.
For instance, if your team closes 500 deals worth $10 million, your average deal size is $20,000. If sales enablement increases it to $25,000, it proves that enablement is helping reps close higher-value deals.
Formula:
Average Deal Size = (Total Revenue / Number of Deals)
Use Spekit to increase your average deal size.
Spekit helps reps close larger deals more effectively by providing instant access to:
- Value-based selling frameworks: To guide reps on positioning value to maximize deal size.
- Upselling and cross-selling strategies: To help reps expand deal opportunities and increase revenue.
- Negotiation playbooks: To provide real-time guidance on securing favorable terms and reducing discounting.
4. Sales Cycle Length and Deal Velocity
“Sales cycle length” measures how long it takes for a deal to move from an initial lead to a closed sale. A shorter sales cycle indicates that sales enablement efforts are improving efficiency, reducing friction, and accelerating deal velocity.
For instance, if your team’s average sales cycle is 50 days, but sales enablement reduces it to 38 days, it proves that enablement is helping reps close deals faster.
Formula:
Sales cycle length = (Total time to close all deals / Number of closed deals)
Use Spekit to shorten your sales cycle.
Spekit helps reps close deals faster by providing instant access to:
- Sales process playbooks: To guide reps through each stage of the sales cycle efficiently.
- Objection-handling responses: To help reps address concerns and remove deal roadblocks.
- Real-time content and CRM insights: To make sure reps always have the right information at the right time.
5. Time to First Deal
“Time to first deal (TTFD)” measures how long it takes for a newly hired sales rep to close their first sale. A shorter TTFD indicates that onboarding and training programs effectively prepare reps to sell faster and contribute to revenue growth sooner.
For instance, if new reps previously took 90 days to close their first deal, but after implementing sales enablement, that time decreases to 60 days, it proves that enablement efforts are accelerating rep readiness and productivity.
Formula:
Time to first deal (TTFD) =
(Total time taken by new reps to close their first deal / Number of new reps)
Use Spekit to reduce TTFD.
Spekit helps new reps ramp up faster by providing instant access to:
- Onboarding playbooks: To guide new hires through important training and sales processes.
- Product and sales training modules: To make sure reps quickly gain the knowledge needed to sell effectively.
- CRM-integrated coaching: To deliver real-time insights and best practices within reps' workflow.
6. Actual Selling Time
“Actual selling time” measures how much time sales reps spend on revenue-generating activities like prospecting, pitching, and closing deals.
A higher percentage of selling time indicates that sales enablement initiatives are reducing administrative tasks, improving efficiency, and allowing reps to focus more on selling.
For instance, if reps currently spend 50% of their time on selling activities, but after implementing sales enablement, that increases to 65%, it proves that enablement efforts are increasing productivity and allowing reps to close more deals.
Formula:
Actual selling time = (Time spent on selling activities / Total working hours) × 100
Use Spekit to increase actual selling time.
Spekit helps reps maximize their selling time by providing instant access to:
- Automated training and process guidance: To reduce time spent searching for information.
- AI-powered content delivery: To instantly provide relevant sales materials when reps need them.
- CRM-embedded insights: To minimize manual data entry and administrative work.
7. Quota Attainment
“Quota attainment” measures the percentage of sales reps who meet or exceed their sales targets within a given period.
A higher quota attainment rate indicates that sales enablement initiatives are effectively improving rep performance and equipping them with the skills, training, and tools needed to hit their goals.
For instance, if 60% of reps meet their quotas, but that increases to 75% after implementing sales enablement, it proves that enablement is directly contributing to stronger sales performance.
Formula:
Quota attainment = (Number of reps who achieve quota / Total number of reps) × 100
Use Spekit to improve quota attainment.
Spekit helps reps achieve their sales targets more consistently by providing instant access to:
- Sales training and coaching resources: To help reps continuously refine their selling techniques.
- Objection-handling frameworks: To equip reps with strategies for overcoming common sales challenges.
- Real-time deal guidance: To ensure reps follow best practices throughout the sales cycle.
Three best practices for measure sales enablement's success properly
1. Start small – measure 3-5 KPIs and refine regularly
When starting with sales enablement measurement, we recommend focusing on 3 to 5 KPIs to ensure your team understands and takes action on the data.
Tracking 10 KPIs might seem ideal, but in practice, it can dilute focus. Too much data can overwhelm teams and lead to inaction.
We also recommend assigning ownership of data review to a specific person or team, with a structured cadence for analysis and decision-making. Reviewing data bi-weekly helps spot trends early and ensures decisions are backed by real insights.
“It's easy to make assumptions as to why a certain program or piece of content appears to be working but the data and internal insight could paint a different story. Sync tools like Spekit to where it makes sense so data is more functional and easier to analyze in comparison to each other where possible.”—Jacki Arnic, Spekit
2. Create shareable, trackable links to demonstrate buyer engagement
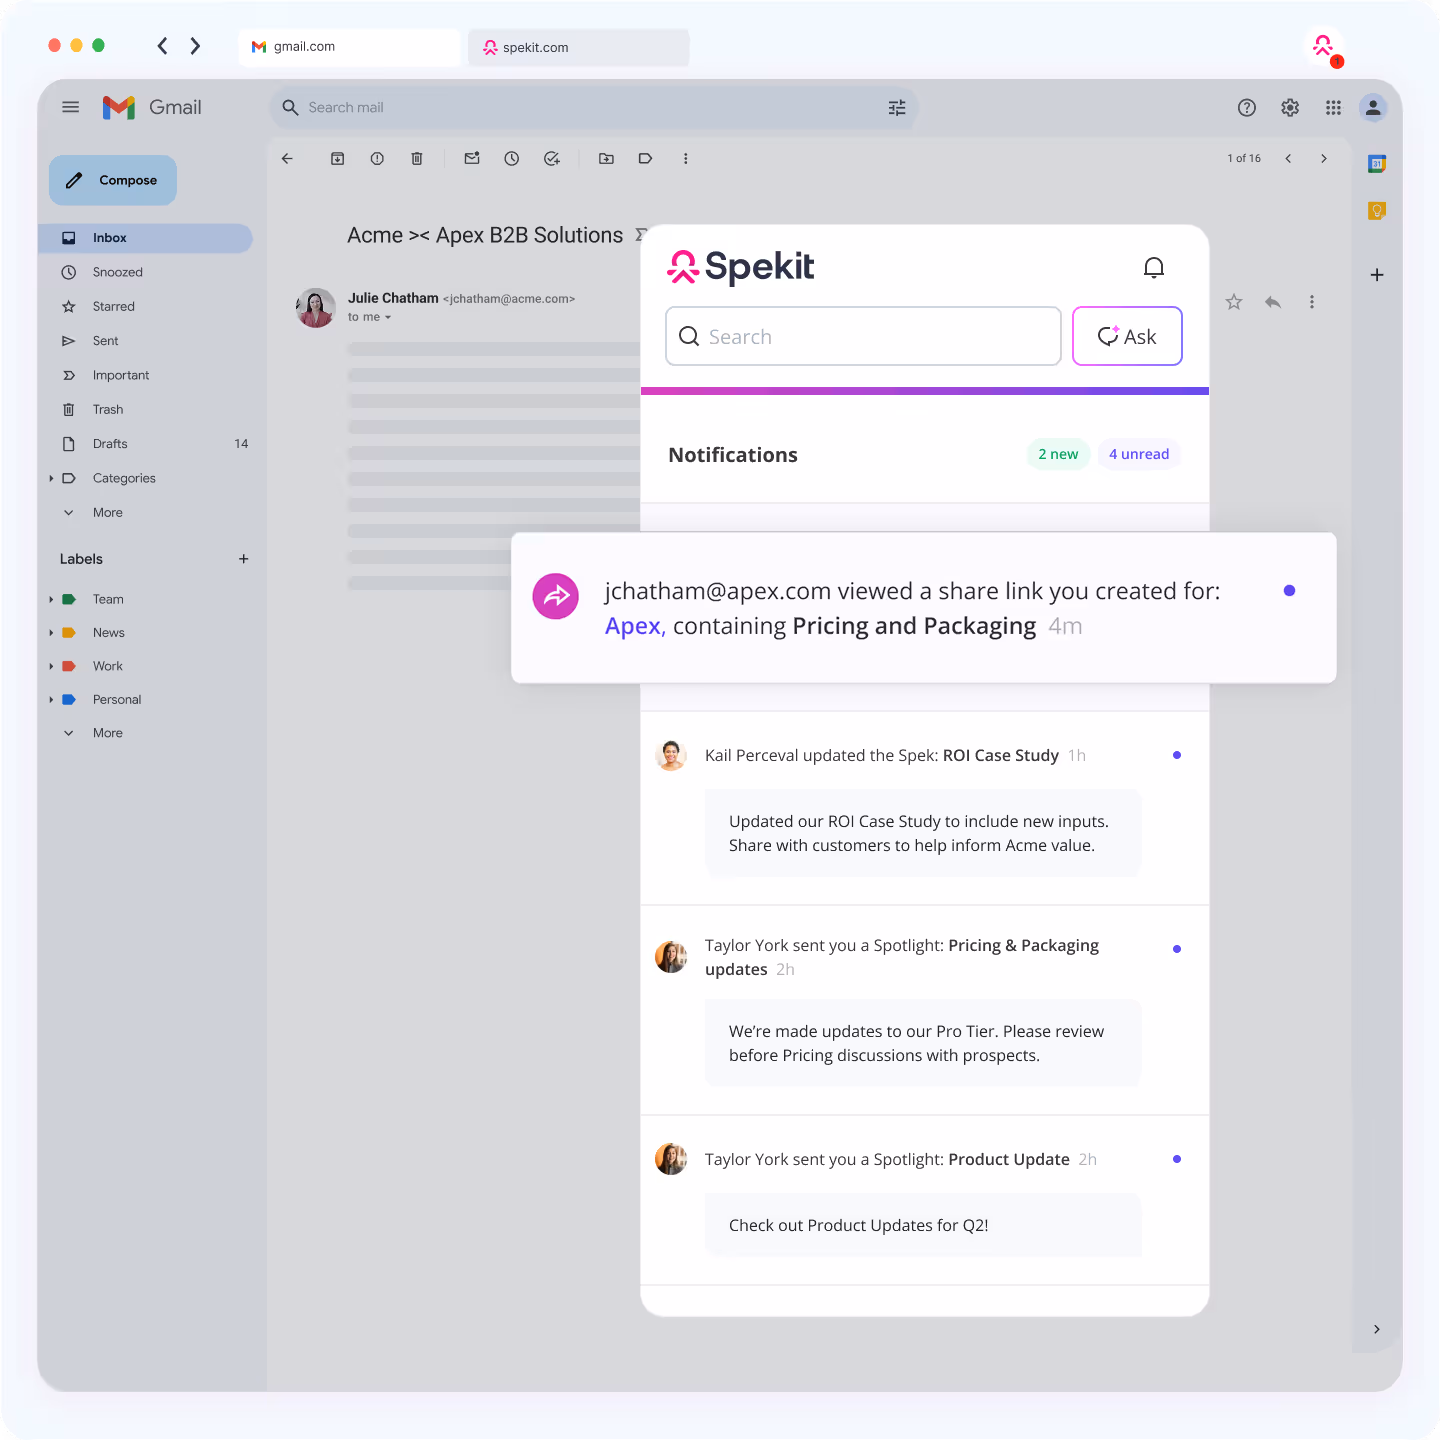
One way to measure sales enablement success is through trackable links. For example, trackable links in Deal Rooms let you and your sales reps know when buyers open and engage with sales enablement content.
Your sales reps get real-time alerts when content is being engaged with (great for identifying hot leads). And, as a sales enablement team, you can quickly analyze the impact of your marketing materials and use that to prove ROI internally.
3. Measure how often your sales enablement content is actually used by sales reps
Your sales enablement software should give you stats on content usage - this data is incredibly useful for proving the impact of your work. For example, with comprehensive sales enablement analytics, you can trace the engagement rate of all your enablement resources, helping refine materials over time and measure the impact of new training materials and resources as they’re launched and on an ongoing basis.
For example, with Spekit you can trace the engagement rate of all your enablement resources. Not only does this help you refine your materials over time, but it also helps you easily measure the impact of new training materials and resources as they’re launched and on an ongoing basis.
Spekit uses “freshness” and “popularity” to help you prioritize what content needs to be optimized to ensure reps always have the most up-to-date knowledge at their fingertips.
All of these touchpoints are a great way to measure the success of your sales enablement content.
Use both qualitative & quantitative KPIs to measure sales enablement success
Tracking quantitative KPIs alone isn’t enough.
While metrics like quota attainment, deal size, and sales cycle length provide measurable proof of success, they don’t tell the full story.
Qualitative KPIs, such as sales process proficiency, demo proficiency, and rep confidence, help connect numbers to real-world rep effectiveness.
To measure impact, compare pre- and post-enablement results, and calculate ROI to link sales enablement efforts directly to revenue growth.
But remember, sales is both a science and an art. Success isn’t just about knowledge. It’s about how reps connect, adapt, and sell with confidence.
As Jacki Arnic puts it, “Qualitative KPIs like confidence and knowledge retention make up about 50-60% of a rep’s success. The rest comes down to selling style and adaptability.” Measure those.
Ready to track, measure, and prove the ROI of sales enablement? See Spekit in action. With real-time insights into content engagement, sales performance, and rep adoption, you can see what’s working, refine enablement strategies, and directly tie efforts to revenue growth.